Tracking Scope 3 emissions is complex, but graph-based modeling provides a smarter solution. Let’s explore what’s next for Scope 3 analytics!
What Are Scope 3 Emissions?
Scope 3 emissions are the indirect carbon footprint of a business, stemming from activities across its value chain. This includes emissions from purchased goods, travel, commuting, waste disposal, and product use and end-of-life disposal.
The Complexity of Scope 3 Emissions
Tracking Scope 3 emissions is complex due to data gaps from unreported supplier emissions, the ripple effect of non-linear supply chains, inconsistent calculation methods, and the challenge of complying with multiple regulatory frameworks like the GHG Protocol, CDP, and TCFD.
The Power of Graph-Based Modeling
Graph-based modeling revolutionizes Scope 3 analysis by mapping value chain connections, uncovering high-emission hotspots, enabling predictive analysis, and utilizing AI to automate data aggregation—driving more informed insights and effective sustainability strategies.
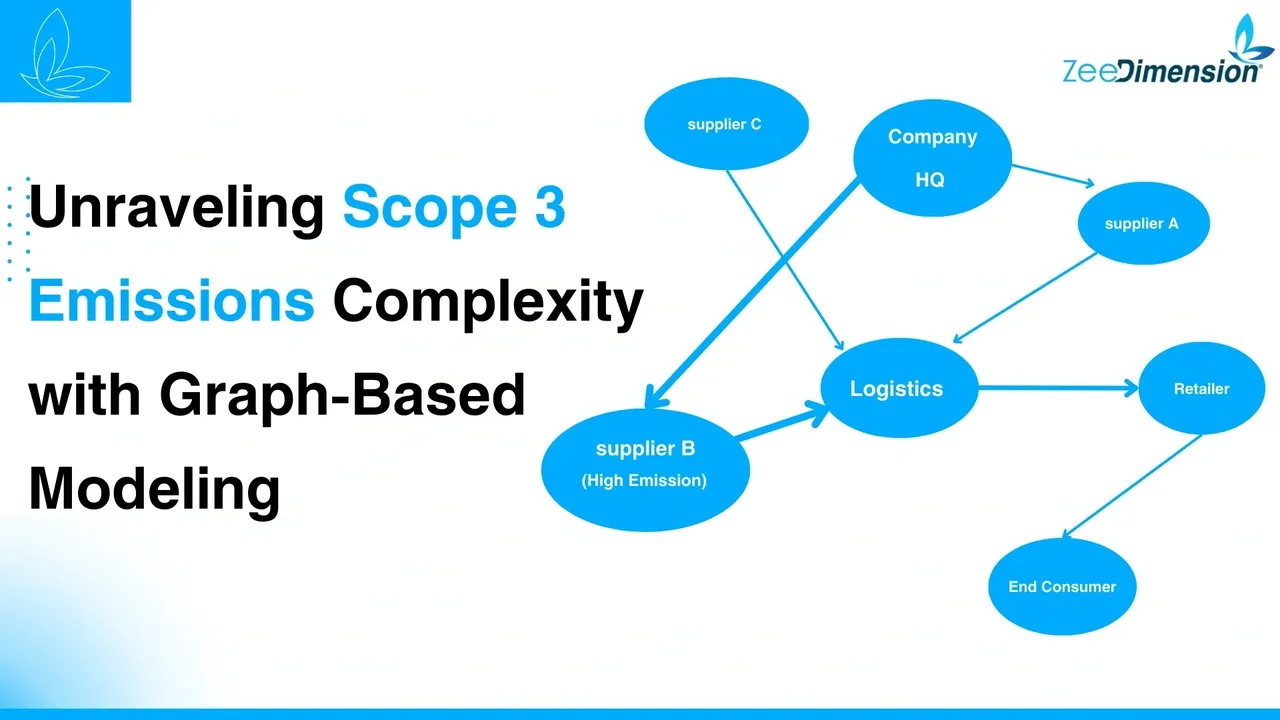
How Graph-Based Modeling Works
Graph-based modeling views entities (suppliers, manufacturers, logistics, consumers) as nodes, with edges representing transactions and interdependencies. It uncovers emission hotspots, provides a holistic value chain view, and helps optimize supplier and material choices.
Challenges in Graph-Based Scope 3 Modeling
Barriers to adoption:
Incomplete Data – Many suppliers don’t disclose emissions.
Computational Complexity – Massive networks need advanced processing.
Standardization Issues – No universal framework for graph-based GHG reporting.
But the future looks promising…
The Future of Scope 3 Analytics
The future of Scope 3 analytics is being driven by AI-powered self-learning graphs for improved predictions, blockchain for secure data verification, IoT for real-time tracking, and digital twins to enhance reduction strategies. These innovations are revolutionizing emissions management.
Conclusion & Call to Action
Scope 3 emissions tracking is advancing, with graph-based modeling offering fresh opportunities. Unlike traditional models, which oversimplify supply chains, graph-based approaches reveal deeper network insights. Powered by AI and real-time data, the future of emissions tracking is here. What’s your biggest challenge with Scope 3 tracking? Let’s chat together!
